
Roslyn, or the .NET Compiler Platform as it's now called, is the new compiler services included with Visual Studio 2015 and ASP.Net vNext.
It is partly driven by the continuously advancing IDE's and "productivity tools" which need deep understanding of the compiler. What used to be a black box, is now opened up and available for inspection and modification.
There are already several blog posts 1,2 on using this for code quality analysis, and as I have a test case which I would really like to put into our build pipeline it was time to dig in.
When you start reading the documentation and other resources out there, it does not take long before you stumble upon the Syntax tree with it's nodes, tokens and trivia. To quickly understand what this would look like I soon figured that it might be a good idea to visualize a tree for a really simple and know application; Hello World!.
First I thought I could just set a break point and visualize using a watch, but no need for that. The Rosly team made a plugin for Visual Studio called Rosly Syntax Visualizer, infact it is included in Visual Studio 2015 preview.
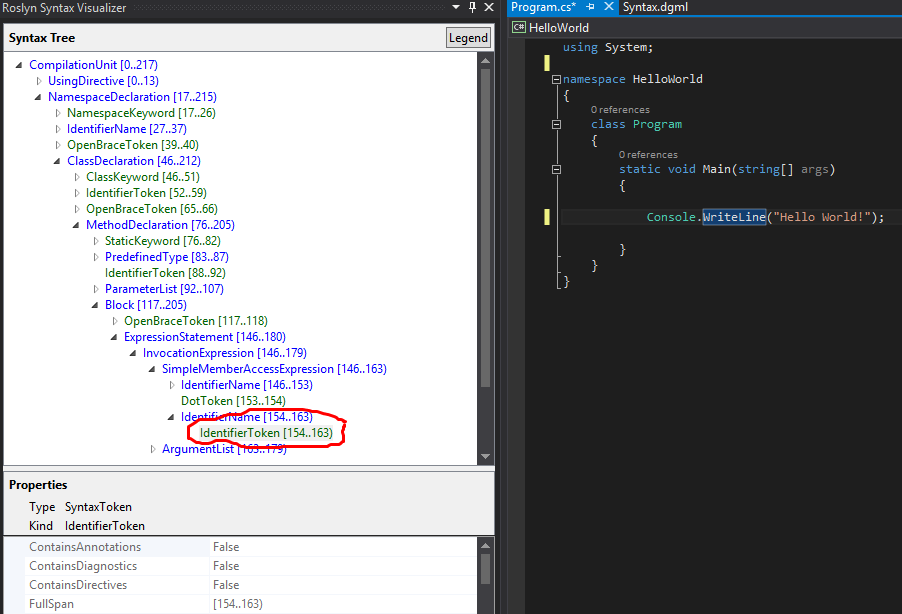
The Roslyn Syntax Visualizer is available under View -> Other windows -> Roslyn Syntax Visualizer. When you pop it up, it will be empty until you open a code file.
Our code is a simple command line app with Hello world.
When we place the cursor in the code, the Syntax tree will automatically expand and navigate to the matching node.
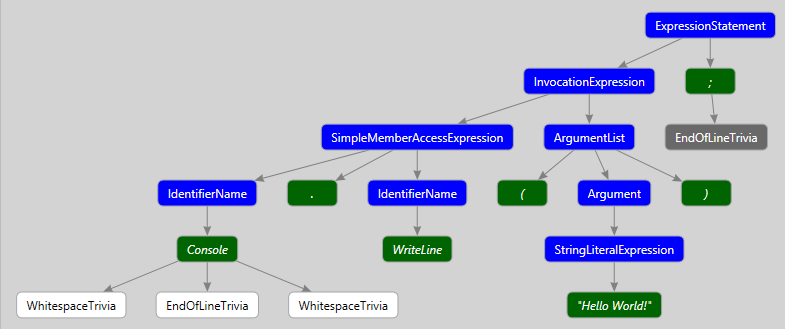
The code syntax visualizer can also render this in a more graphical representation, by right-click in the tree you can select "View Directed Syntax Graph". In the example below the graph is drawn for the body for the Main method.
The Syntax Visualizer is a really nice tool when learning and working with the .NET Compiler Platform.